|
Listen to this post
Getting your Trinity Audio player ready...
|
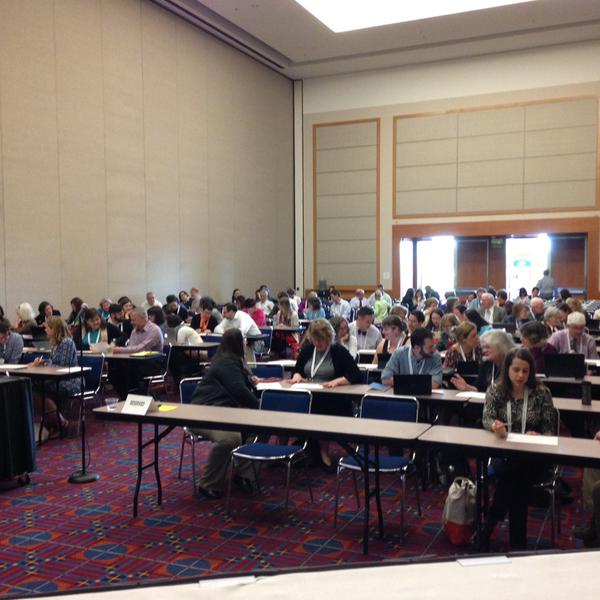
At the end of March I had the great fortune to attend the ACRL meetings in Portland, OR. I was presenting once again with my drinking buddies colleagues Andrew Asher, Maura Smale, Mariana Regalado, and Lesley Gourlay on our ethnographic work in libraries and universities. We have all been working with cognitive mapping techniques in a variety of contexts, and we thought it would be fun to not just talk about them but to have people attending our session do their own mapping, and think about how the technique would be relevant to the work they are doing in their own libraries. I suppose I could have blogged about this under “workshops” but it was a funny hybrid of conference presentation and workshop, one that I thought really worked.
You can see from the Storify that people were really enthusiastic and engaged. After Andrew introduced the concept of cognitive mapping (I riff off of a version pulled straight from his ERIAL project here), we had the people in the room draw their own maps of their own practices. People smiled as soon as we asked them to draw, but the room *really* erupted (in a good way!) when we asked them to discuss their map with their neighbors.
We then had people report out to the entire room about what surprised them about their maps, either the ones they drew themselves, or the ones that had been shared with them. As was the case in the workshops I ran in the UK and Ireland in March, I witnessed epiphanies, clear moments when people, simply because they had visualized their practices in a relatively simple way, gained a new understanding of what they do and why–and, more importantly, what they might want to change.
There was nice Twitter participation, Andrew and Maura and I were managing to live-tweet, because we took turns talking (always present in groups you guys IT IS THE BEST PEOPLE ARE FUN). When we asked people to tweet their maps many did. I appreciate not just the participation, but also the content of the maps, which reveals just as wide a range of practices as those found among students and faculty in the US and the UK. Some people mapped multiple locations.
My learning spaces, such as they are. #acrl2015 #cogmaps pic.twitter.com/xmCxmT447p
— Meredith Farkas (she/her) (@librarianmer) March 27, 2015
Some mapped just a single desk.
https://twitter.com/silvia_vong/status/581520978364080129
Some mapped not just locations, but tools and companions:
https://twitter.com/bfister/status/581520470907875328
The content of all of these maps echo findings collected in our own fieldwork (I have blogged about my own mapping projects already here, here, and here). What I love about that is that we didn’t discuss our cognitive map examples until after we had gotten people to draw their own. So the discussion was not esoteric, but grounded in their very recent experience of trying the method , and the things they saw in student and faculty maps could be immediately connected to the things participants mapped for themselves. You can see the Prezi that we used to illustrate the discussion here. I believe the slidecast will eventually be made available on the ACRL conference site.
I am a big fan of conference events that require participation, “lean forward” kinds of things that don’t allow for slouching in the back and glazed eyes to set in. I think if more conference sessions were workshops, roundtables, actual exchanges of ideas, encouraging people to think about or actually do something concrete with the ideas in play, there would be far less of a sense of wasting people’s time, or rehashing old debates. I was so pleased at the interest in the room, at the specific things that our session made people consider, at the plans for their own libraries that people took away with them.
So, thank you to those who attended, and please keep us all posted on where you take this instrument, and how it affects you and your library going forward!
And keep taking pictures of your shoes, obviously.
https://twitter.com/DonnaLanclos/status/581534780581249024

